A brief history of Citrix EdgeSight and Director
Citrix EdgeSight 5.4 was released in 2011 with added support for XenApp 6.5 on Server 2008 R2 and SQL 2008 R2. EdgeSight has an overwhelming amount of detail about your XenApp 6.5 farm; it has alerting, tons of reports built on SQL Reporting services, a realtime dashboard, user and device troubleshooters…and then some.
The staggering amount of data and tools available in EdgeSight were also one of its biggest problems: getting it deployed in a way that made it effective was difficult – using EdgeSight and keeping it healthy were equally as challenging.
Issues were common- the rscorsvc.exe or fbserver.exe processes could be found crashing or consuming a large amount of resources themselves; sometimes Windows updates caused data uploads to fail. Don’t get me wrong – EdgeSight is a great product…there’s just one problem: XenApp\XenDesktop 7.x – are the end of EdgeSight as we know it.
Citrix has tried to get back to the same level of functionality by using two separate products – Desktop Director, a web based management tool, and NetScaler HDX Insight, an add-on to NetScaler ADC. There are a few problems with this approach:
- Director is a help desk management tool first and a performance monitor second – the only issues that are immediately obvious are failed server\desktop machines and failed connections
- There is no in-depth reporting and there is no alerting
- Integration and licensing of the two products is confusing – basically if you want more than a week of data, you need platinum licensing, and if you want HDX Insight, you need at least NetScaler Enterprise or Platinum
- Up until Director 7.6 build 200, the interface was very basic and difficult to navigate; objects that should have been links were not
The biggest issues with the “new EdgeSight” are the lack of proactive alerting which existed in 5.x and an even worse is that EdgeSight has never been able to see outside of the Citrix environment itself. Most Citrix deployments have some or all components that run in a hypervisor with shared storage, virtualized networking, and far more complexity than servers on bare metal. EdgeSight has NEVER been able to directly monitor your hypervisor – and this is a big blind spot.
Enter Goliath Technologies Performance Monitor (GPM)
In relation to EdgeSight, GPM provides the following functionality:
- Alerting and reporting; as an added bonus, SQL Server Reporting Services is not required (EdgeSight 5.x)
- Realtime status dashboards (EdgeSight 5.x, limited 7.x)
- ICA\HDX data (EdgeSight 5.x and 7.x)
- Session information and logon times (EdgeSight 5.x and 7.x)
- Underlying OS performance data (EdgeSight 5.x)
Additionally, the following data is also available:
- Hypervisor compute performance
- Hypervisor storage performance
- Server and Desktop monitoring
- Other application workload performance (database, mail, web, etc)
- Logon monitoring via logon simulation
The Goliath Performance Monitor installation experience
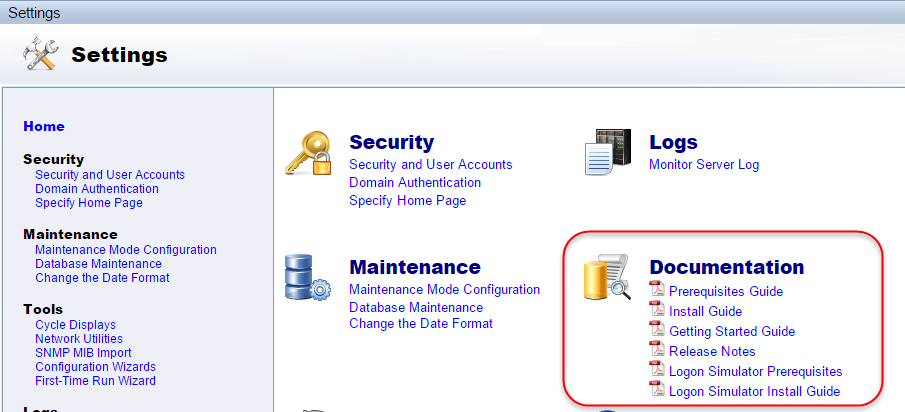
Installing GPM is fairly straightforward – the current guide with requirements and supported software can be found here:
http://goliathtechnologies.com/wp-content/uploads/2015/03/GPM_Install_Guide.pdf The configuration of GPM is made easier with discovery – adding a hypervisor connection will immediately present an inventory of virtual machines to which you can install agents to if desired. Further, there are help links and full documentation available directly on the web front end:
A look at GPM’s features like agent and agentless monitoring
This post is about a performance monitoring solution – as such, there will be lots of screenshots and graphics.
GPM is capable of monitoring using agentless communication via SNMP or API; alternatively, a lightweight agent can be deployed. Keep in mind that this is by no means a local firebird database on every server to be monitored – the agent requires ~.1% CPU, 1.5MB on disk, ~24MB RAM\~50MB RAM for XenApp servers. Additionally, the retention of metrics and data gathered by the performance monitor are not limited by a license – only by database storage.
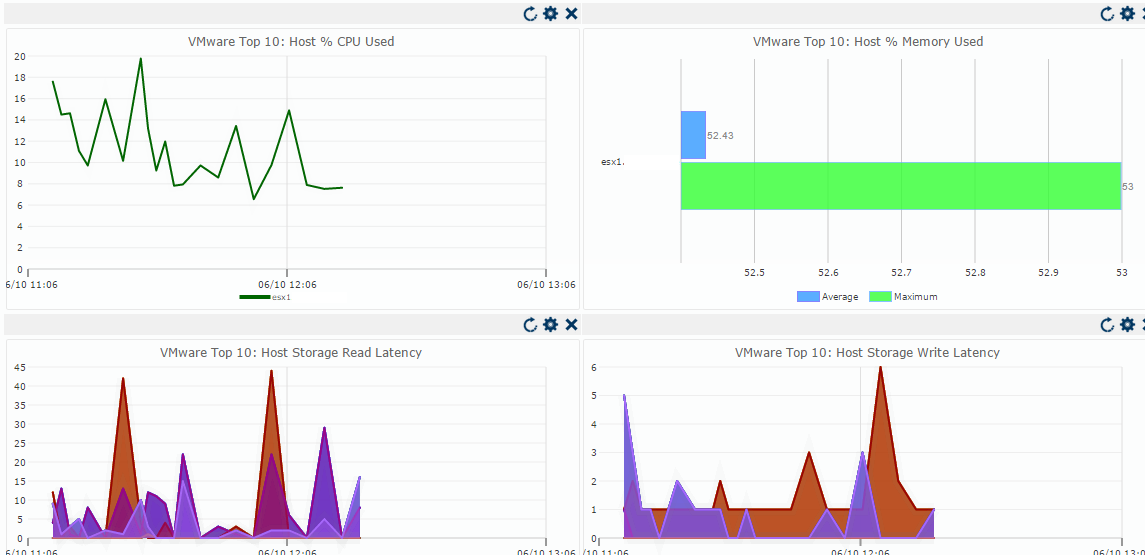
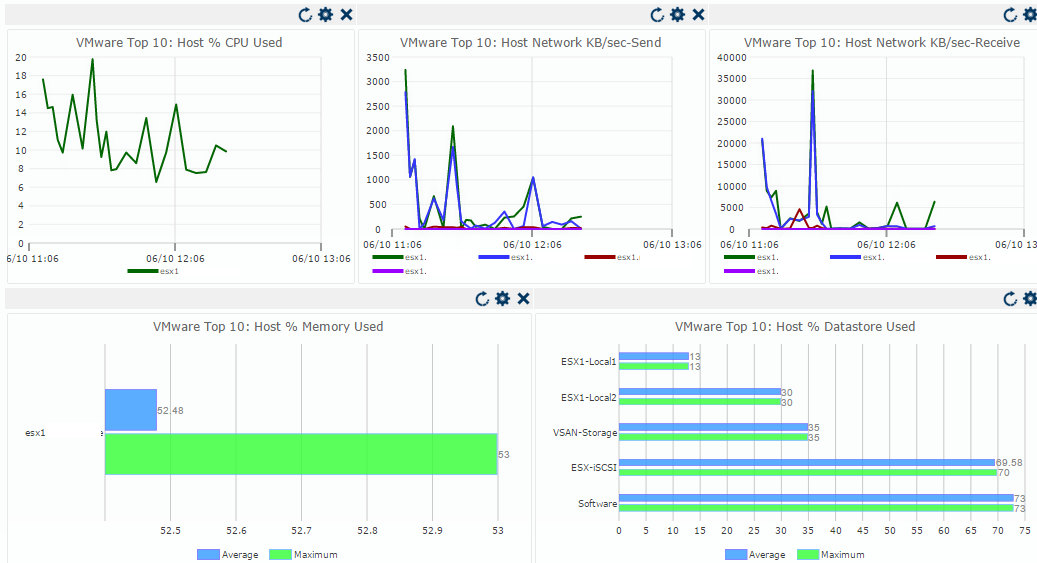
The first object I added was for the hypervisor using agentless API – one of the key items missing in EdgeSight. Within moments of supplying credentials, I was greeted with a nice dashboard of compute performance – *note only a single host is shown here
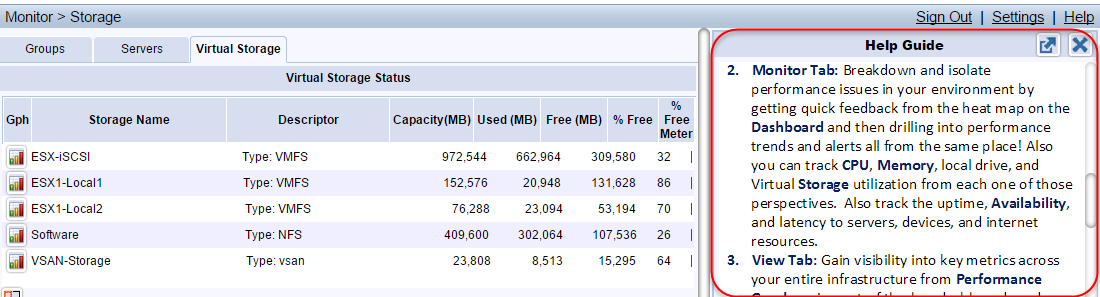
Hypervisor data of any kind is simply not available in current or previous versions of Citrix EdgeSight. Next, a few dashboards that show potential bottlenecks in the underlying virtual infrastructure:
Host Bottlenecks:
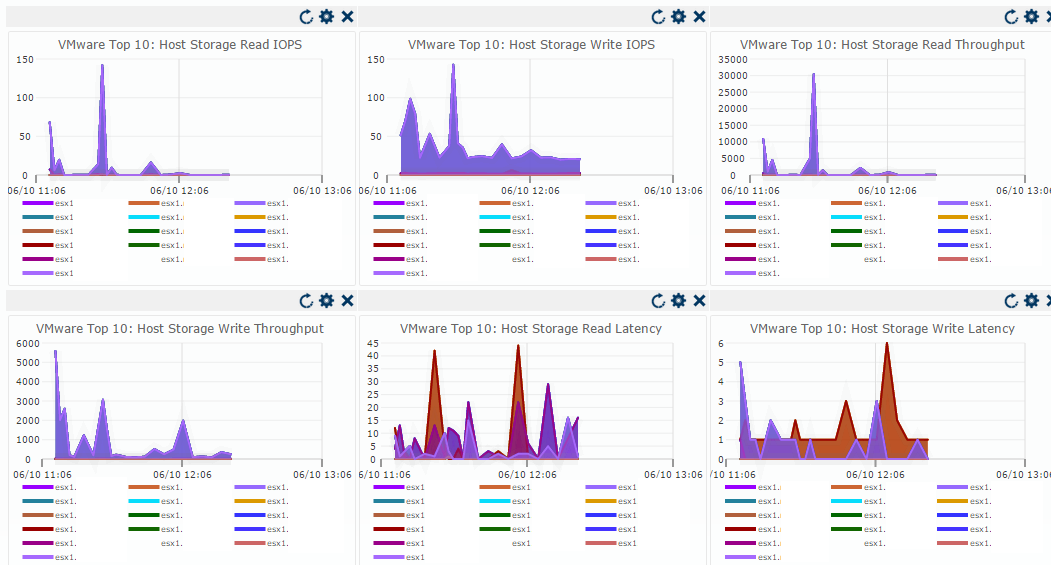
Host Storage Bottlenecks:
Virtual Machine Bottlenecks:
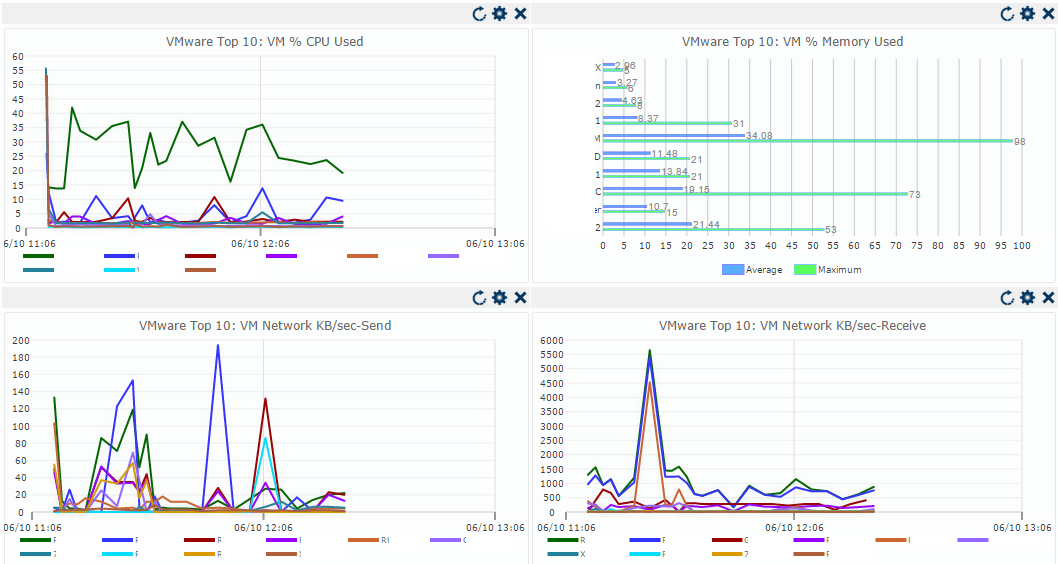
Virtual Machine Storage Bottlenecks:
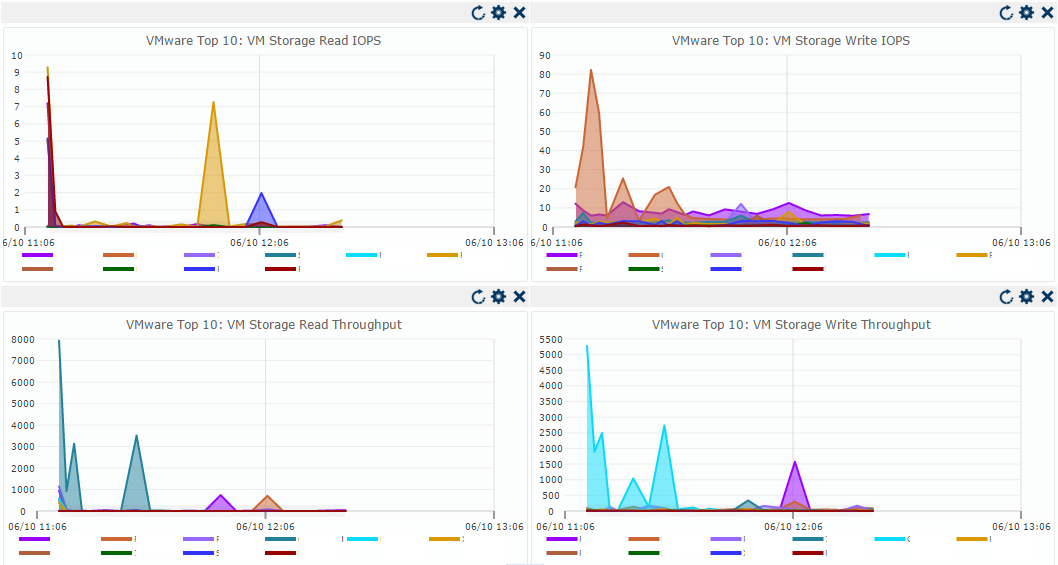
Using GPM to quickly view the severity of performance issues
Something that is very similar to EdgeSight is the “fault dashboard” view, or “Green is good, Red is bad” view. With GPM, the color coding ranges in shades of yellow and orange to show severity of the alarm – these can be customized within the rules and assignments section. This allows your NOC to proactively monitor the Citrix infrastructure and see when things are ‘going south’.
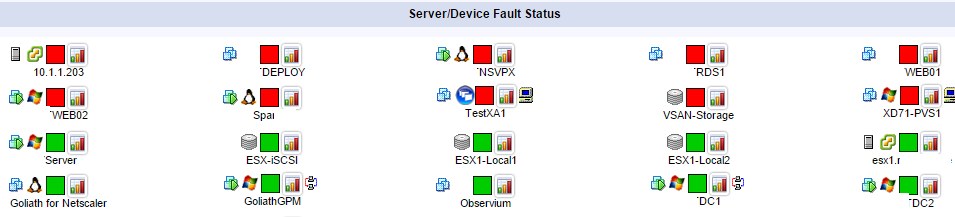
It should also be noted that all charts\graphs can be moused over to get more detail of data points; all of the icons on the fault dashboard are clickable to show alerts (if any) or the metrics – which is a TON of information:
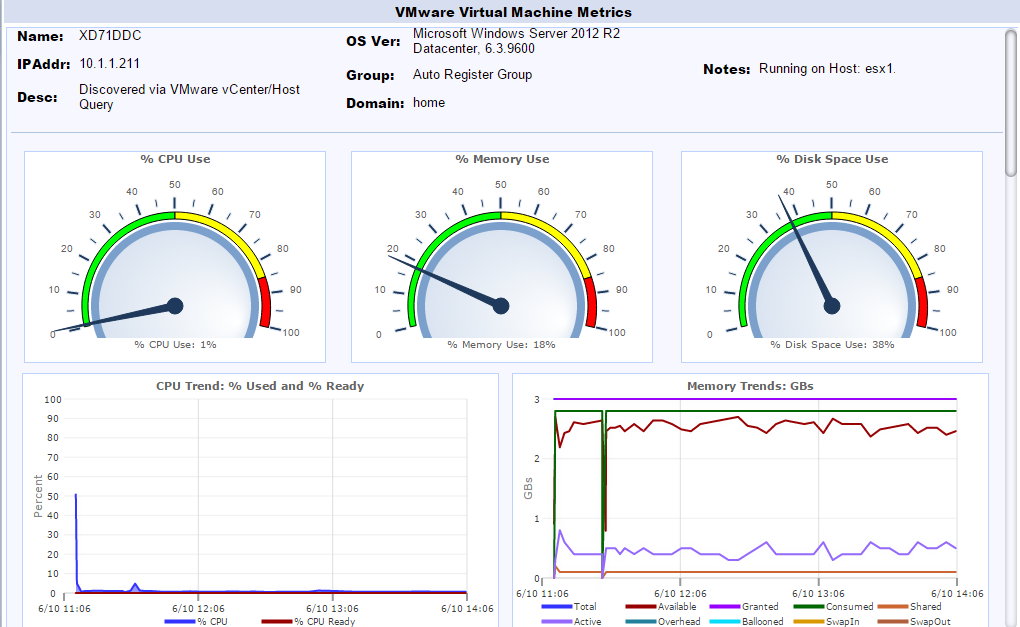
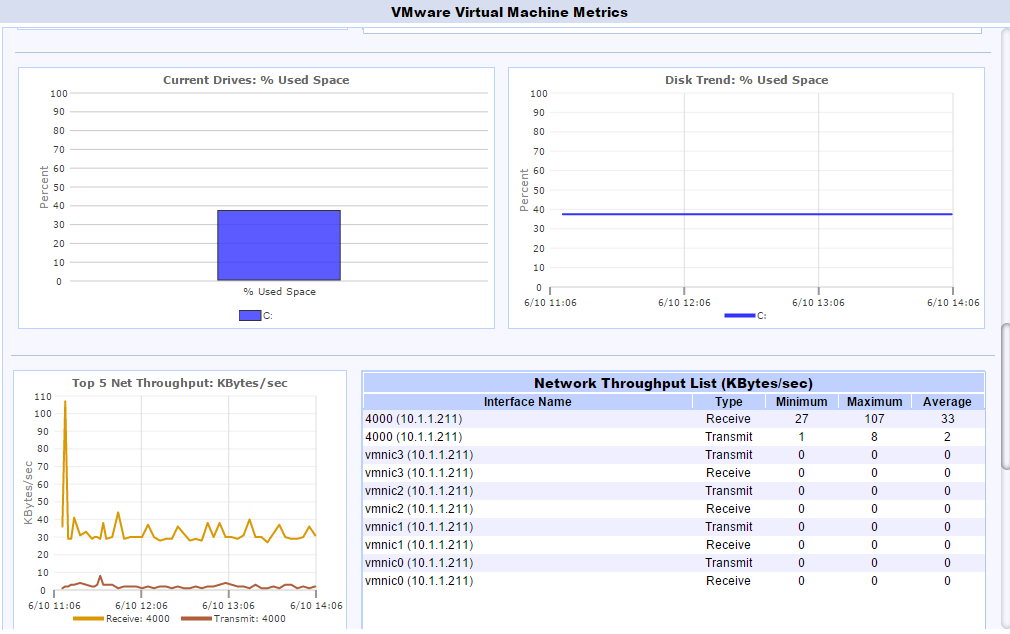
The ‘Virtual Machine Metrics’ page shown above is accessible from nearly any view – making it extremely easy to access a devices performance while troubleshooting an issue.
GPM has a much-needed alerting feature missing from EdgeSight
One of the most-missed features of EdgeSight in 7.x is alerting – there simply isn’t any. The GPM monitoring and alerting engine is powerful – notifications can be sent via Email, SNMP trap, syslog, TAP via modem, or Beeper service; remediation actions can be taken; and all of this can be scheduled based on number and\or duration of alerts. Monitoring rules can be easily assigned to groups of systems.
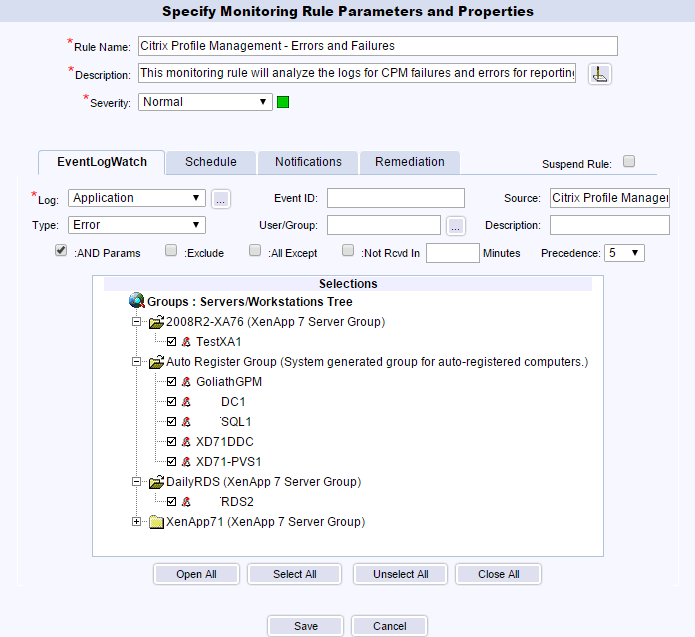
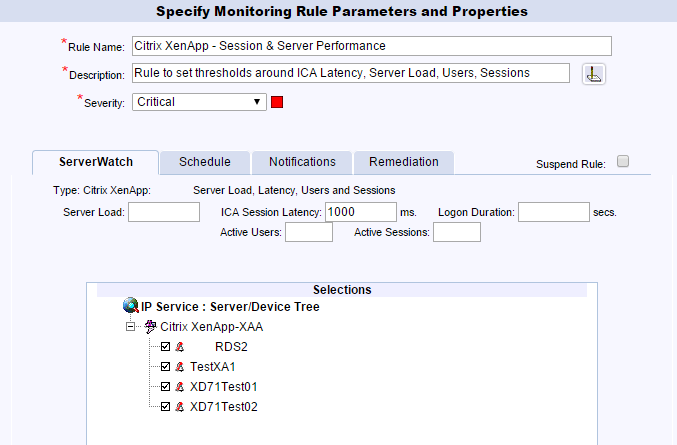
And there are already predefined monitors for Citrix, including load, session latency, logon duraction, and active users\sessions
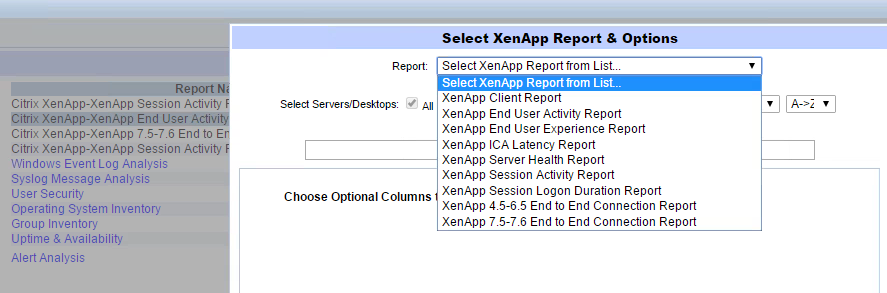
How performance reporting works with GPM vs EdgeSight
EdgeSight 5.x offered a TON of reports – almost too many; most admins probably only ever ran a small handful or had them scheduled to be run. GPM offers a limited number of Citrix specific reports – both for XenApp and XenDesktop, but all of the available reports offer good value.
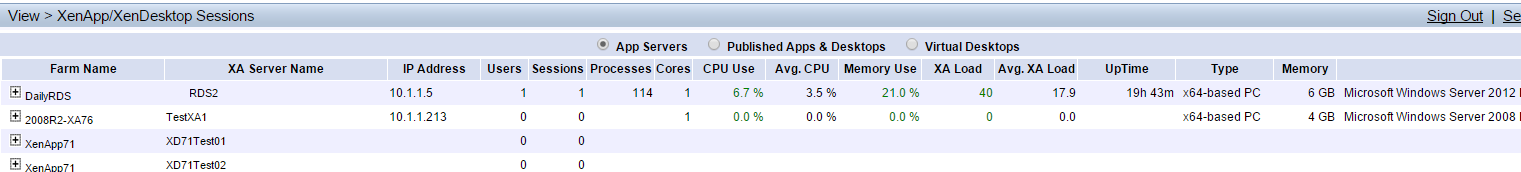
Lets cover some of the ICA\HDX performance metrics – this is where most other monitoring products pale in comparison to Citrix’s EdgeSight. First, a basic dashboard with user\session count, load, and basic details:
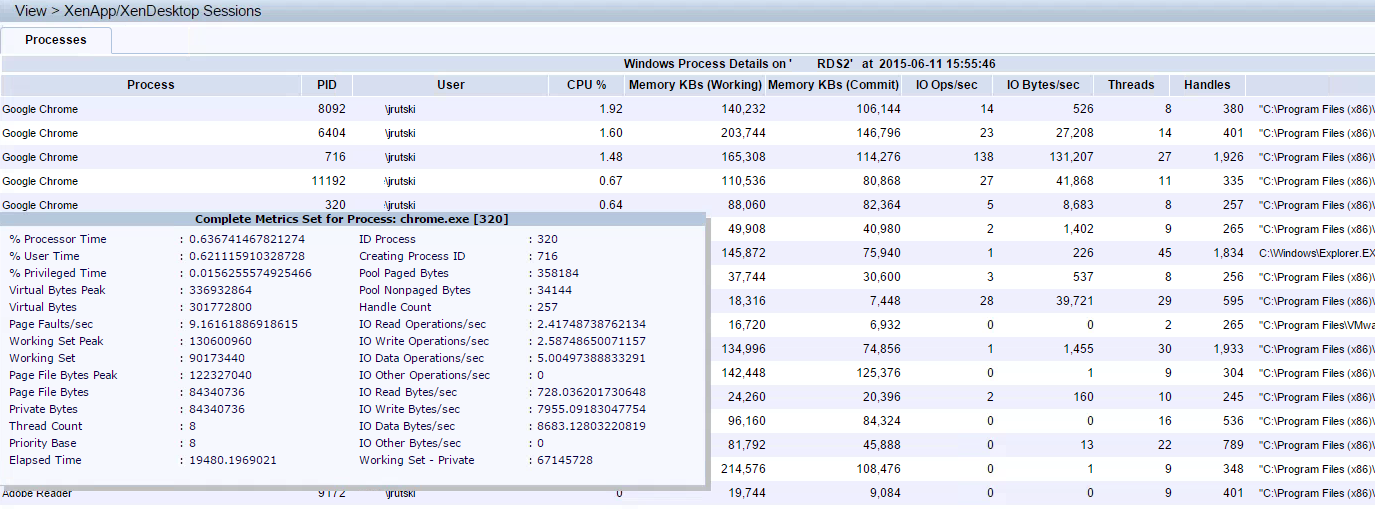
In EdgeSight 5.x, process information was very granular; EdgeSight 7.x leaves a lot to be desired – GPM has got it covered.
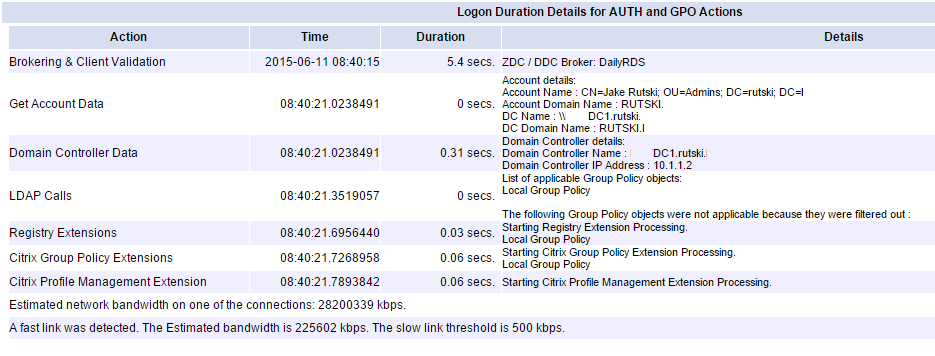
User logon duration is another key factor in every Citrix environment:

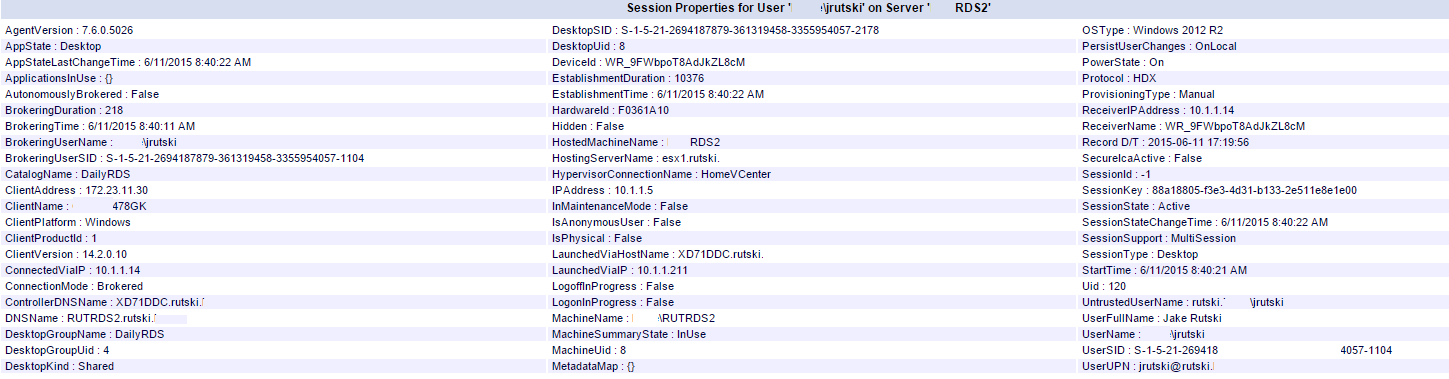
And further detail is available for each session:
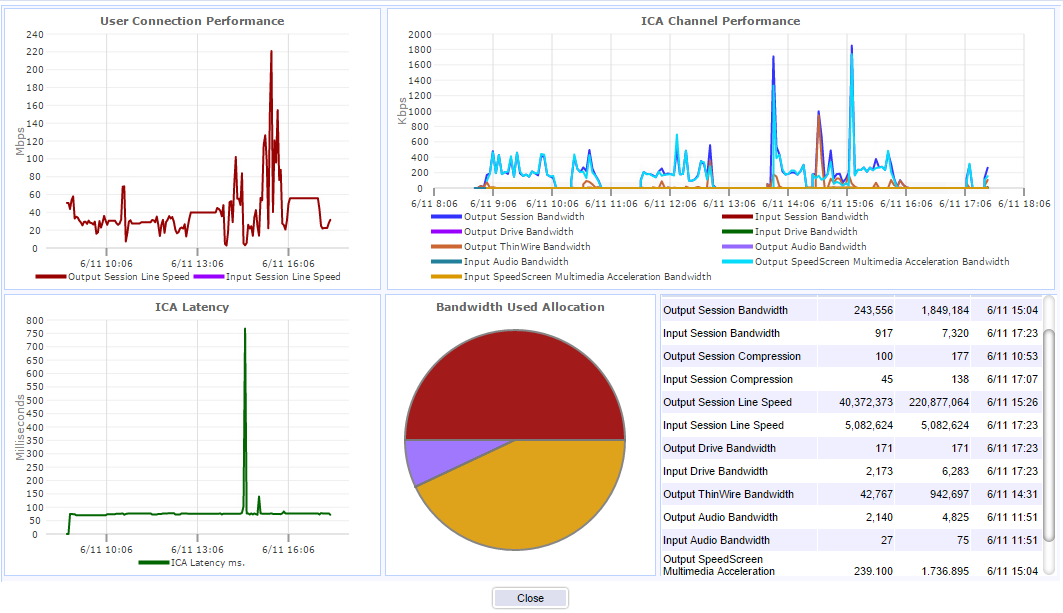
ICA\HDX session data is also a must have as once again, the current Director console does not compare to EdgeSight of old. For user sessions, here is the data that is available in GPM:
…and ICA\HDX metrics:
Does Goliath’s Performance pass the test as an EdgeSight replacement?
Hopefully, you can see from the screenshots above that the Goliath Performance Monitor is a great replacement for Citrix EdgeSight for XenApp\XenDesktop 7.x. It not only covers the features that the current implementation lack such as alerting, real-time reporting, historical reports, and custom configuration, it also brings features that were never available in any version of EdgeSight such as virtual compute, storage, and networking metrics. GPM is far simpler to install than EdgeSight 5.x was and provides the same functionality with several added benefits.
Goliath Technologies also has a logon simulator that further allows support staff to proactively monitor the health of the Citrix farm and view first hand if an application or desktop launch is successful and how long it takes – this will be covered in another post. Additionally,
Goliath for NetScaler provides AppFlow metrics and modules that integrate and monitor several
healthcare EMR\EHR applications are available from Goliath Technologies.