This is a minor release.
What’s new:
- Support for VMware PowerCLI 6.0 (Note: I have not fully tested on vSphere 6 yet – this is just to support the new cmdlets)
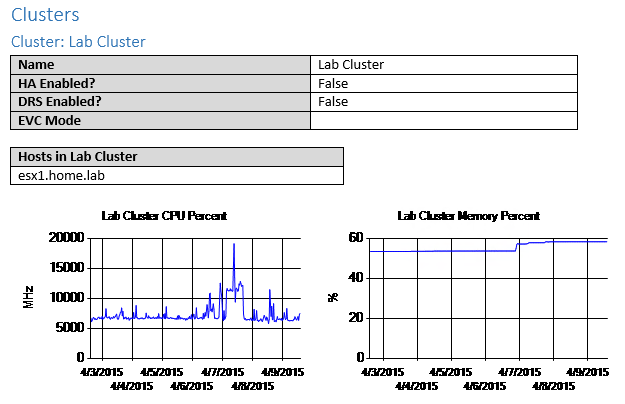
- Beta performance graphs for Hosts and VMs
- Use the -Chart parameter to give this a try
- Requires .NET chart controls (http://www.microsoft.com/en-us/download/details.aspx?id=14422) – They are included in Windows8\2012 and .NET 4.0 I believe
- Temporarily saves .PNG images before importing them into the Word document
I am still working on output to HTML and full support for vSphere 6.0 – download the latest version here: CarlWebster.com
See below for the expected output of the performance charts – again this is beta, so please let me know of any issues, thoughts, or recommendations.