We all want seamless rollouts of Citrix XenApp\XenDesktop and we use a number of tools to achieve that reality. I’ve found a unique software that allows me to proactively understand the performance impact of Citrix XenApp\XenDesktop on the IT infrastructure and ultimately end user experience early in the deployment lifecycle.
In this post I will give you 4 examples of how to use the software to avoid potential issues.
VDI deployments
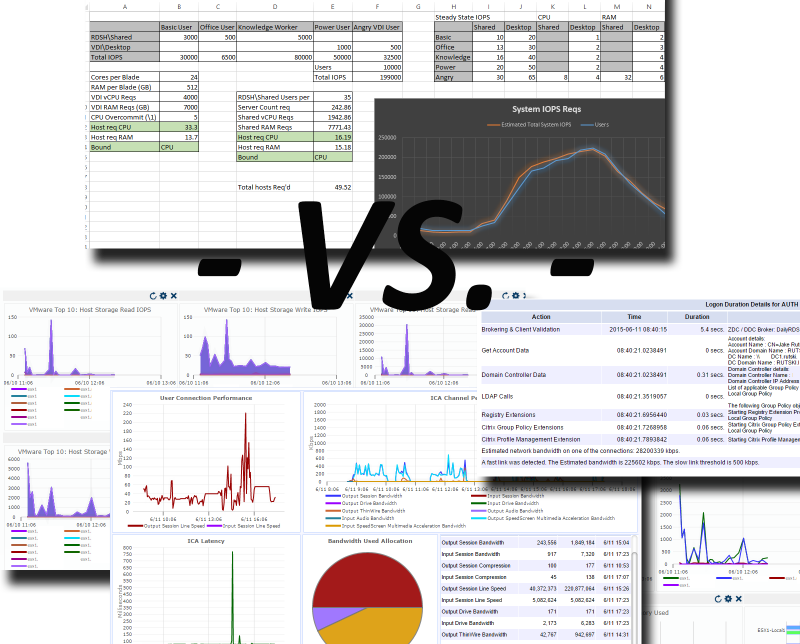
When large VDI deployments are being designed and architected, lots of numbers get tossed around from compute requirements, storage capacity and IOPS, to user count, application set and type of user. Most integrators will use some form of a spreadsheet, tool or assessment to gather user data, compile it all and generate some reports that try to estimate requirements for the environment – for the most part, this is fine – for just that – estimation. What I am going to discuss is manual calculation vs. purpose built software.
Once the project gets underway and things start coming together, the first item on the list is usually testing by a small group of pilot users in the technology group. Then another business unit, usually close to the IT group, is allowed access to test. Then another. Once a few groups of test users have given their blessing on the pilot environment, it is rolled into a full production, highly available, high performing (hopefully) infrastructure. And the last step is usually the scariest – the flood gates are opened and a large population of staff are migrated into the environment…here’s to hoping it goes well. But there can be some problems with this procedure; a monitoring product that can actively monitor the performance of the overall environment as well as actively test logons should be deployed from day one to not only avoid potential issues, but also to accelerate the deployment and help guarantee successful project completion. Goliath Performance Monitor (GPM) paired with Goliath Logon Simulator is such a product.
Problem 1: Not all monitoring solutions are created equal
A monitoring solution that only uses SNMP, WMI, and NetFlow is not a monitoring solution that I would consider capable of watching over 10,000 desktops on top of a hypervisor, on shared storage and networking in the datacenter. A proper tool must integrate and gather data directly from all layers in the environment – including the hypervisor, the compute, and the software orchestrating thousands of connections every day.
Monitoring tools that are built to monitor networks and Windows servers may not be capable of knowing which counters to use or how to integrate with Citrix specific APIs to align Citrix session behavior and performance with infrastructure conditions. Furthermore, technologies dependent on wire-data have no facility to provide the needed information because they have no mechanism to leverage the APIs or context from where the sessions take place – the servers.
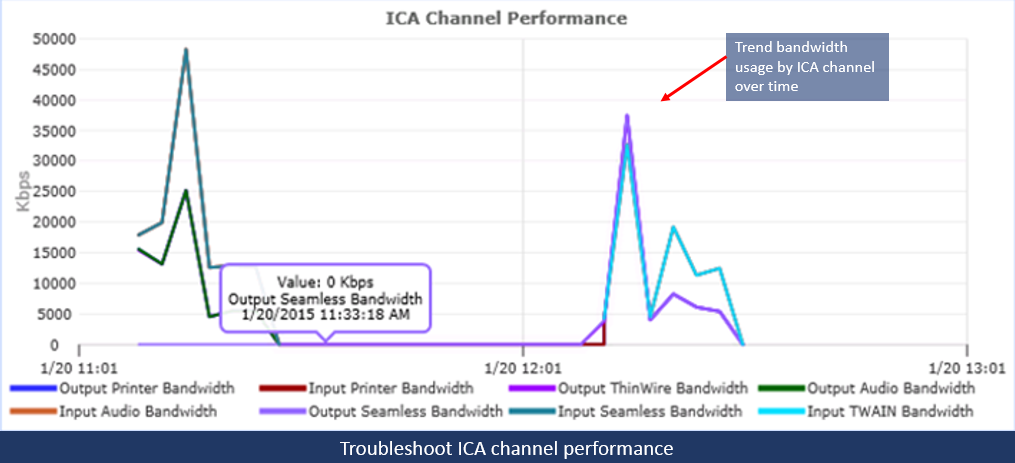
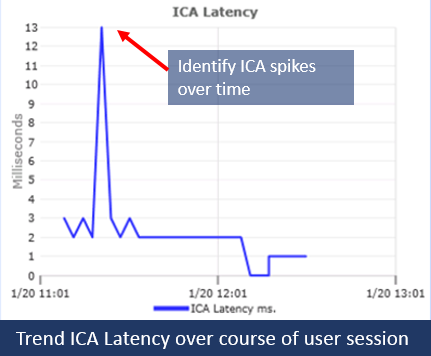
Having the ability to understand, monitor, report and alert at every layer of a complex deployment empowers technology staff to know exactly what is going on in the VDI environment, when there is an issue, and where to start troubleshooting. For example, one can troubleshoot slow session performance by digging into the ICA channel.
Goliath Performance Monitor is Citrix Ready and VMware Ready for the hypervisor as well as XenApp\XenDesktop and VMware Horizon (with View) – this means there is direct integration with these products and their APIs to gather direct and accurate data.
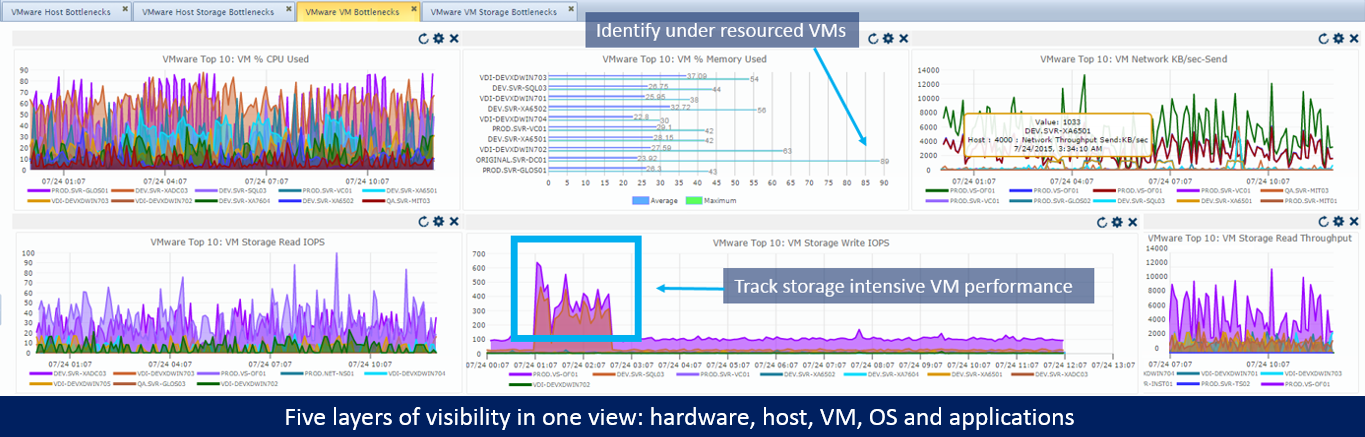
SNMP simply does not allow for this deep integration and data gathering. See below – Goliath Performance Montiro has out-of-the-box performance graphs to gain full visibility into the hypervisor and VMs trending over time.
Many small IT groups are often in ‘catch-up’ mode where it is hard to get ahead; they are constantly fighting fires, cleaning up the network, and trying to stay ahead of the next hardware failure or management request. IT managers will say “let’s not fix tickets as they come in, lets resolve the issue before the users are aware of it”.
When consultants are hired to deploy a new solution, staff are often left with little knowledge about the new system and may not know where to look to begin troubleshooting. In the case of larger organizations, trying to implement a monitoring tool to troubleshoot a pre-existing performance issue will prove difficult. Having performance data from day zero will allow staff to go back through history and see exactly when the disk latency went above 30ms average, or when the hypervisor host CPU became so overcommitted that the CPU wait times rose above 500ms.
Problem 2: Project designs use estimates for compute and storage
Estimating the requirements for any virtualization project is difficult – especially when you are talking about thousands of end user desktops in the datacenter. Designs for these projects are estimates – and estimates are not always completely accurate. If a design calls for 300,000 IOPS for desktops often times the budget may not allow for much more than that. The problem comes when a boot or logon storm happens during 50% system load and consumes all available storage I/O.
All the users on the system just saw an hourglass or saw their session hang because the storage latency is well above the acceptable 5ms average. These problems don’t show up during the pilot phase when there is only 2-5% test load. Once the project is half way completed, it is too late to order more hardware due to under-spec’d designs.
If storage is not designed properly, you may end up with very high average datastore latencies – GPM will show this:
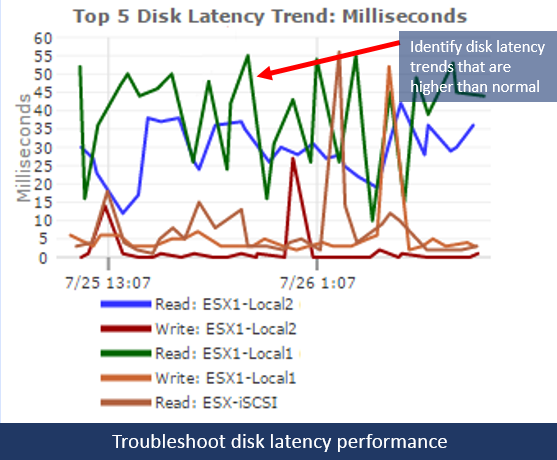
Hopefully it can be addressed before users begin complaining about terrible performance.
Problem 3: Changes break things
The natural progression of any large deployment requires a great deal of work and most of that work is making changes. Any of the normal steps in a project have the potential to disrupt – adding capacity by deploying more servers, changing SSL certificates, changing security or permissions – all these changes can go so far as to completely bring down the environment.
Additionally, changes during a proof-of-concept or initial deployment may not be run through a change control, making them difficult to track and even harder to determine if a change is the true cause of an outage. The dreaded Citrix Storefront ‘Cannot complete your request’ error can rear its head when changes are being made to Storefront or the NetScaler Gateway configuration.
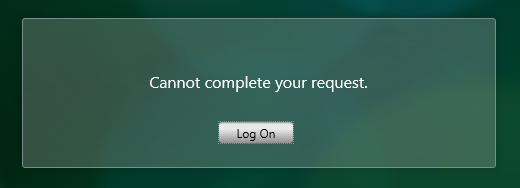
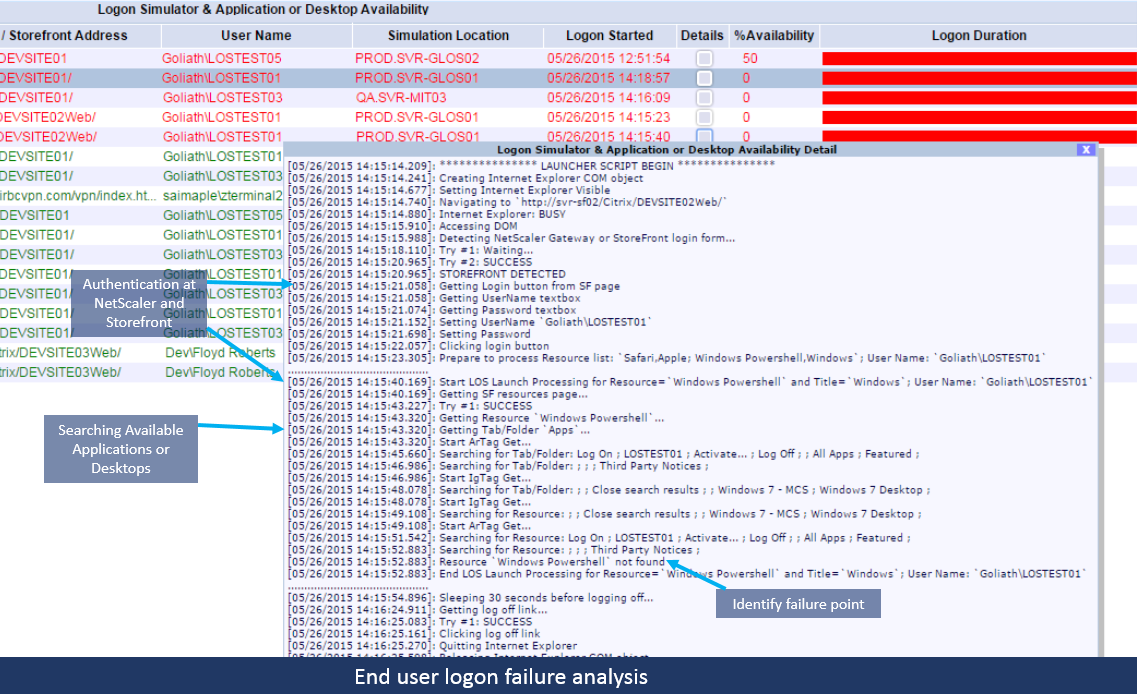
The Goliath Logon Simulator will detect this issue immediately – by having a monitoring tool running from the beginning of the project you will be alerted immediately if the most recent change broke remote access or crippled performance. In the screenshot below, GLS is alerting us that the application was not found:
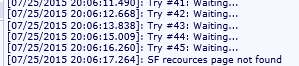
Another example where the logon could not complete:
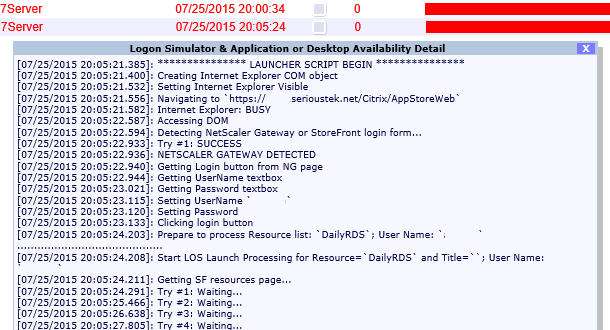
…and alert you that the Storefront resources were not found.
By having a monitoring tool running from the beginning of the project, you will be alerted immediately if the most recent change as broken remote access or crippled performance. Even more taxing to the system is the ‘ramp-up’ period when more and more users begin to logon to the system – if it was not designed correctly, you need to know as soon as possible, and a static design guide spreadsheet isn’t going to do that for you.
Problem 4: Technology staff are not always the best test users
The pilot phase or proof-of-concept deployment gets started with some small percentage of users testing the environment – usually the technology group and associated support staff. This leads to the first problem: Most technology staff don’t see issues and bugs as a big deal.
It’s similar to alarm fatigue in the health care industry – the IT staff are always so busy resolving issues or responding to production problems that a warning message in the proof of concept environment is not that big of a deal. It is also difficult for technology staff to ‘eat their own dogfood’ – when they have so many other means to get work done, it may be difficult to convince them to use the unproven pilot environment.
Using the monitoring tools by Goliath Technologies will allow deep insight into an otherwise complex and overwhelming environment. By setting up the GPM at the beginning of the project you will have historical data to help determine if the sizing and design of the infrastructure is up to par and allow you to troubleshoot any “growing pains” during the project ramp up that would otherwise lead to delays.
To try all fo these products in your own environment, get a 30-day free trial or demo of Goliath Performance Monitor or get a 30-day free trial or demo of Goliath’s Logon Simulator for Citrix.