The debate over enterprise monitoring solutions that use agentless technology VS those that use agent software has been around for as long as monitoring has existed, and I’m not going to cover it in great detail as there is nothing new:
Agent monitoring:
- Able to gather numerous data points, including those not otherwise exposed
- Communication can be configured and secured
- Need to install, maintain an agent
- Additional software can introduce extra load
Agentless monitoring:
- No additional software running
- Easy to deploy – no software to deploy, update, maintain
- Not as much data is available via SNMP, WMI, SSH
- Communication through a firewall can be tricky
- Still need to configure security
- Service providing the data (SNMP, WMI, SSH) can introduce load to the system
- Only able to report data
Enough about that.
Lets talk about a monitoring agent I’ve been working with: the Goliath Intelligent Agent which is a feature in the newly released Goliath Performance Monitor (GPM) version 11.6. The GPM agent has always existed, but this latest release brings some great additional capabilities:
GPM Intelligent Agent:
- Able to gather numerous data points, including API integration in the underlying Hypervisor and ICA\HDX metrics not exposed in SNMP or WMI
- It consumes minimal resources: .1% CPU, 60Mb RAM for XenDesktop, 100Mb RAM for XenApp, and 1.5 Mb on disk
- Centrally managed install\update, no reboot required for either
- Able to execute remediation actions on XenApp Servers, XenDesktop VDI, Citrix Role Servers, Infrastructure VMs, and endpoints
- Template\Gold image (PVS\MCS) ready
- *Able to monitor local system or remote devices using agentless technologies (SNMP, Syslog)
- *Improved scalability by communicating remote agents through ‘master’ agents rather than directly to the GPM server
- *Specific agent groups can be federated for different purposes – network device agents, hypervisor agents, Windows Server agents
- *Consolidate agent outbound communication to the central server
*New or enhanced features
Metrics Collected by Goliath’s Intelligent Agent
The Goliath Intelligent Agent is able to collect the following metrics:
- Windows resources:
- CPU, CPU queue length and context switches
- Memory and paging metrics
- Disk metrics – queue length, disk latency and IOPS
- Network metrics including retransmits
- Event log collection and analysis
- Service monitoring
- Application performance analysis
- Windows Services
- Custom Scripts such as PowerShell to collect custom metrics
- Custom PerfMon counters
- Application resources:
- Application process performance – CPU and memory utilization
- Application specific faults
- Application services
- Log file analysis
- Custom scripts
- Network and device metrics via SNMP and Syslog
- Custom alerting
Nothing like the EdgeSight Agent
I will tell you right now that Goliath’s Intelligent Agent is nothing like the Citrix Edgesight agent. There is no local firebird database to house the data and the GPM agent consumes far fewer resources. GPM offers the best of both worlds – it is also able to monitor devices where installing an agent is not possible; previously, agentless data gathering was initiated from the central server.
The best part?
All of the different roles and features are available from the same agent software that gets deployed, managed and updated from the central store without having to reboot the endpoint.
The new Goliath Performance Monitor Intelligent Agent can act like another GPM server, allowing you to use agentless technologies such as SNMP and Syslog to gather data in a branch office as well as pass data from other installed agents on to the central server – all while giving you the ability to view all of the data in a single, unified dashboard.
Branch Office Scenario
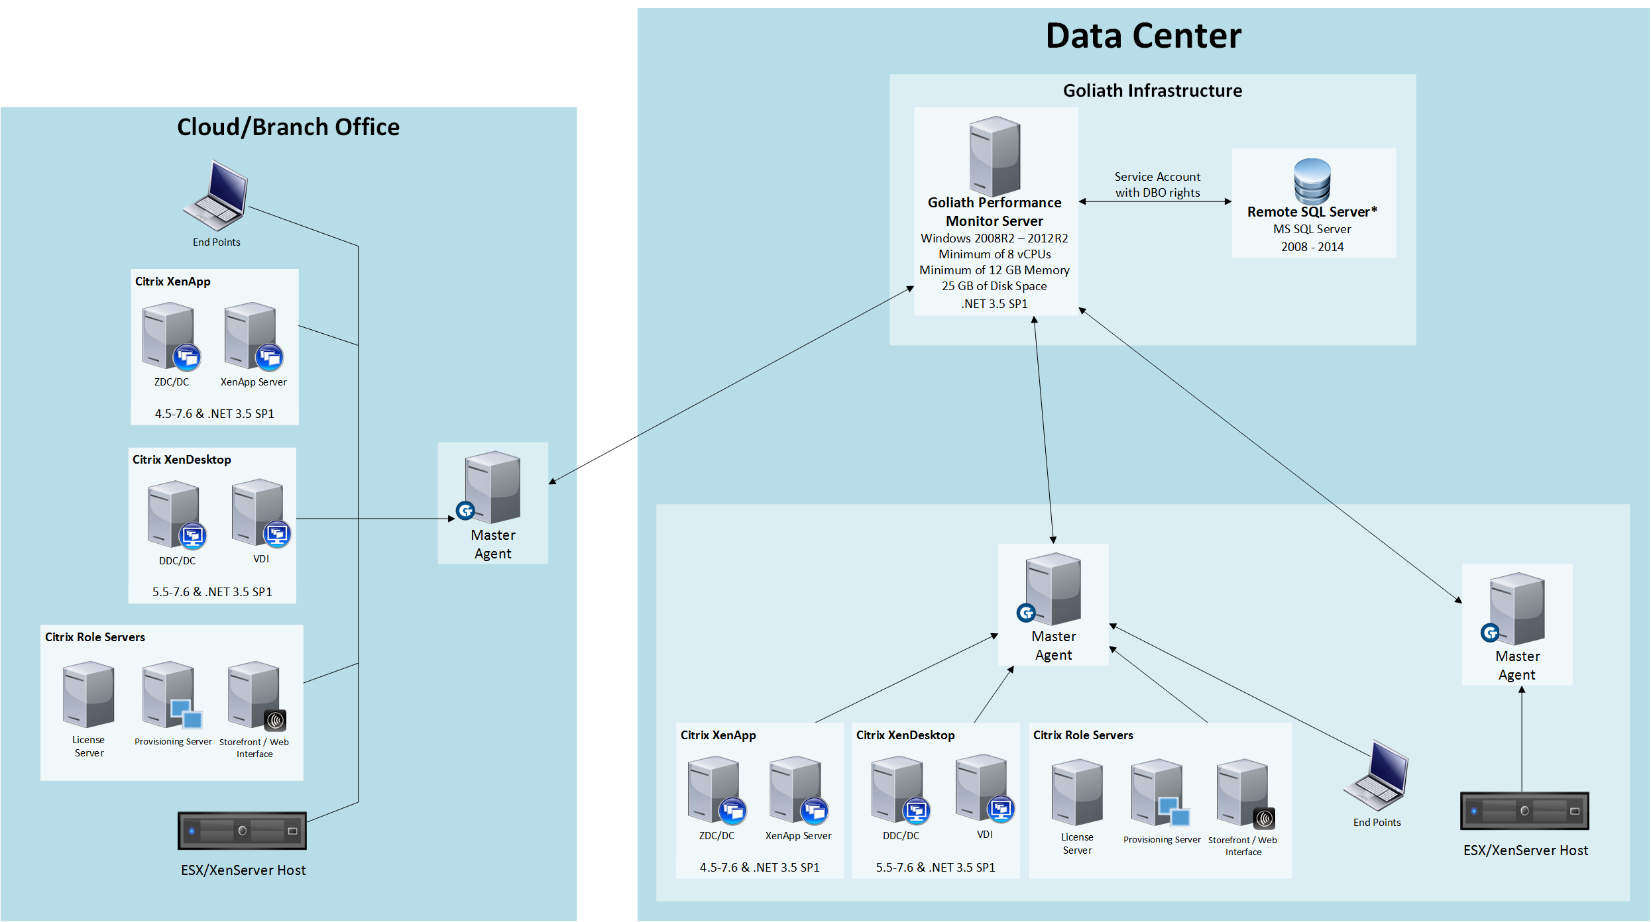
In the diagram above, you will notice that the remote office has infrastructure to be monitored as well as a ‘master’ Intelligent Agent. This allows you to not only aggregate all monitoring traffic to the central server to come from a single point, but also to monitor all non-agent systems locally to that office without having to cross a WAN or firewall. All of the remote office data is presented in the same dashboard – no more guessing is it ‘http://monitorServer01’ or is it ‘http://monitorServer02’?
The remote intelligent agent also provides the ability to execute remediation actions and scripts ‘from the outside’ of the problem – again, without having to cross a WAN\firewall. Also keep in mind that the data is aggregated in real time – any batching or queuing could potentially lead to missing a problem or lost analytics.
Are you ready to consolidate all of your monitoring servers and dashboards into one? Learn more about Goliath’s Intelligent Agent.